Delivery Timeline
This report offers a summary of delivery times throughout the day showing information such as what percentage of sales were delivery for a specific hour
as well as the time it took for the driver(s) to perform the deliveries.
|
Delivery Times |
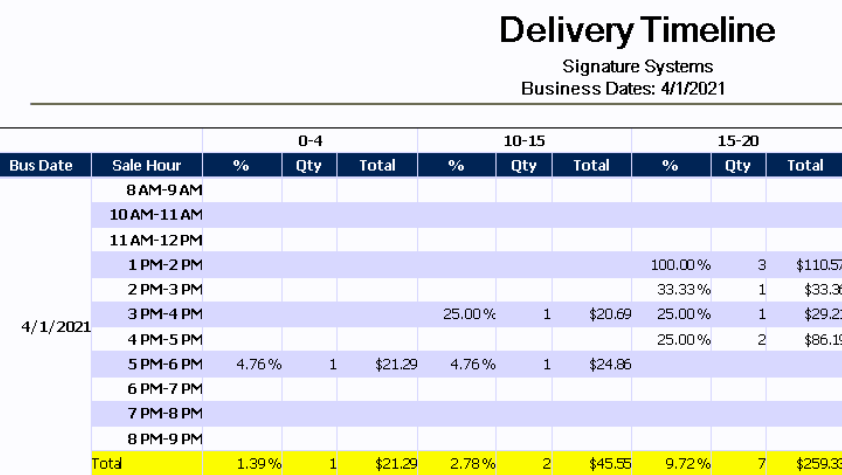
The row across the top of the report shows time ranges (in minutes) allowing you to determine how long deliveries are taking over the course of the day |
|
Bus Date |
Shows the associated business date (this may be different from the actual calendar date depending on when the store performs its Z-Report) |
|
Sale Hour |
This row shows the hour range that the row is reporting. NOTE: Only hours with sales data will be reflected on the report |
|
% |
Displays the percentage of the referenced hours sales that were delivery and meet the delivery time threshold |
|
QTY |
This row shows the number of delivery orders for the hour and delivery time threshold |
|
Total |
Displays the value of delivery orders for the hour and delivery time threshold |
|
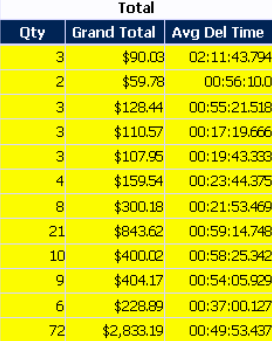
Total |
This row shows the total for the columns based on total sales for the day instead of the individual hours |
|
QTY |
This column shows the number of delivery orders for the referenced sales hour |
|
Grand Total |
Displays the value for all the delivery orders for the referenced sales hour |
|
Avg Del Time |
Shows the average delivery time for all the delivery orders for the referenced sales hour |