Menu Sales
The Menu Sales report contains a total list of items sold for a selected date range. You can filter it by Group, Item or Category. Item detail, such as Transaction Type, Total Value, Cost of Goods Sold and percentage of sales, is also listed for each item.
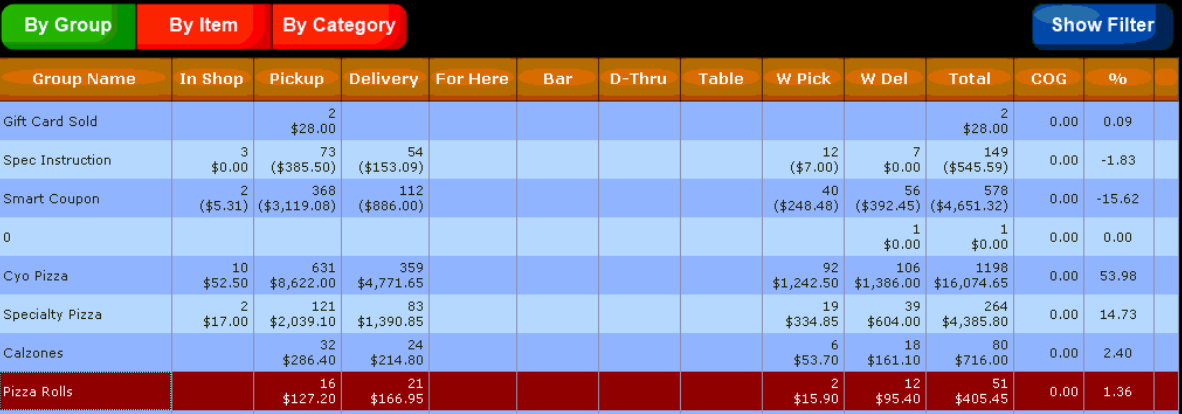

|
Filter Options |
These buttons allows you to filter the report in three (3) separate ways:
|

|
Group Name |
This field name will change depending on which filtering option is chosen (group, item, category) and reflects the associated name of the item being displayed |
|
In Shop |
This column orders the report by orders placed in house (any order not entered by web, or call in) |
|
Pickup |
Orders the report by orders designated as for 'Pickup' ordered by value (not quantity) |
|
Delivery |
This column orders the report by orders designated as for 'Delivery' ordered by value (not quantity) |
|
For Here |
Orders the report by orders designated as for 'For Here' ordered by value (not quantity) |
|
Bar |
This column orders the report by orders designated as for 'Bar' ordered by value (not quantity) |
|
D-Thru |
This column orders the report by orders designated as for 'Drive Thru' ordered by value (not quantity) |
|
Table |
Orders the report by orders designated as for 'Table Service' ordered by value (not quantity) |
|
W Pick |
Orders the report by orders designated as for 'Web Pickup' ordered by value (not quantity) |
|
W Del |
This column orders the report by orders designated as for 'Web Delivery' ordered by value (not quantity) |
|
Total |
This column orders the report by total value sold for the date range |
|
COG |
Orders the report by Cost of Goods sold (COG) based on ingredient cost |
|
% |
This column orders the report by percentage (%) of sales for the date range |